$232,822 spent on AWS in Q3 - A full breakdown of ConvertKit's AWS bill


Overview
We spent $232,822.68 on AWS in Q3 2020. This is down -5.42% from Q2 and is 4.3% of net revenue for the quarter. We spent more on EC2-Instances because we scaled out our Cassandra cluster, but we spent less on EC2-Other because we cut down on regional data transfer. We also cut down on our S3 costs by improving our backup process.
High-level breakdown:
- EC2-Instances - $66,102.39 (+4.13%)
- Relational Database Service - $56,799.12 (-4%)
- EC2-Other - $29,297.85 (-27.73%)
- Savings Plan For Compute Usage - $31,574.40 (+23.9%)
- S3 - $17,923.08 (-22.23%)
- Support - $15,779.26 (-4.24%)
- EC2-ELB - $8,019.36 (-15.98%)
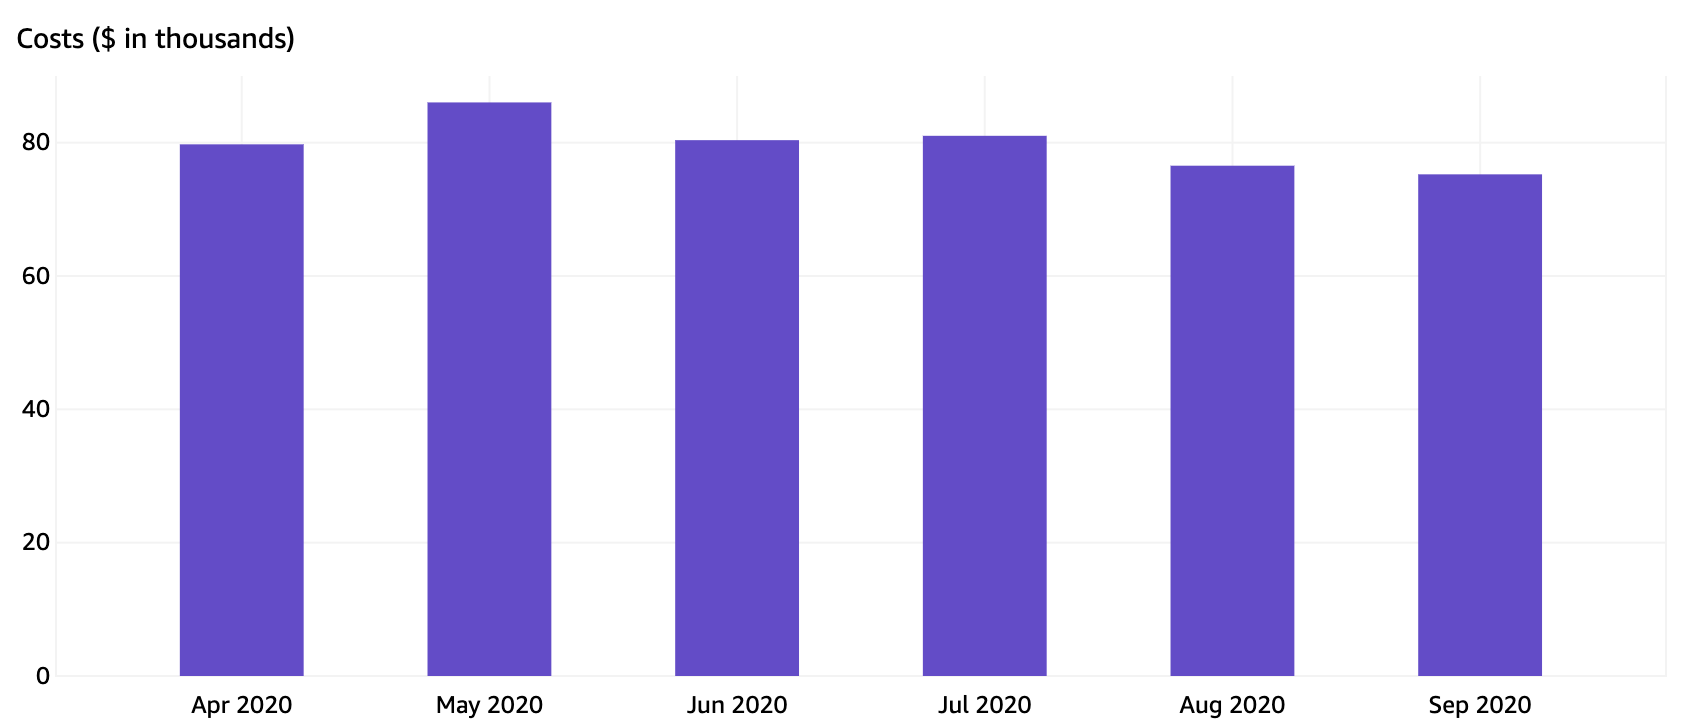
EC2-Instances - $66,102.39 (+4.13%)
We scaled out our Elasticsearch and Cassandra clusters in Q3. We reserved those instances, and we purchased a new Savings Plan in June. Because of those two changes, EC2-Instances and Savings Plan For Compute Usage were the only two line items in Q3 that increased in cost.
Service breakdown
- USE2-HeavyUsage:i3.2xlarge - $21,397.50 (+9.01%)
- These are our reserved Cassandra and Elasticsearch clusters.
- We use Cassandra to store massive amounts of data.
- We use Elasticsearch to search through massive amounts of data and to store our logs.
- The increase in cost comes from scaling out our Elasticsearch and Cassandra clusters to accommodate our growth.
- USE2-HeavyUsage:i3en.2xlarge - $10,881.02 (+3.03%)
- These are our reserved Elasticsearch instances that we use for our Elastic stack.
- We prefer the i3en family to the i3 family for our Elastic Stack because it has a better cost to storage ratio.
- We store about 30TB of logs in hot storage at any given time.
- HeavyUsage:i3.2xlarge - $9,906.58 (+17.76%)
- These are our reserved Cassandra instances replicated in US-East-1.
- The increase in cost comes from scaling our Cassandra cluster to accommodate our growth.
- USE2-HeavyUsage:c5.2xlarge - $4,607.39 (-18.61%)
- These instances are reserved.
- We use c5.2xlarge instances for many different workloads, from serving our web traffic to handling Sidekiq jobs.
- We’ve seen cost reductions here because we’ve optimized our application and scaling policies in Q3.
- These optimizations allowed us to reduce the number of reservations we needed and let some expire.
- USE2-BoxUsage:c5.2xlarge - $3,880.95 (-33.91%)
- These are on-demand instances.
- Due to optimized scaling policies and application performance, we need fewer of these instances.
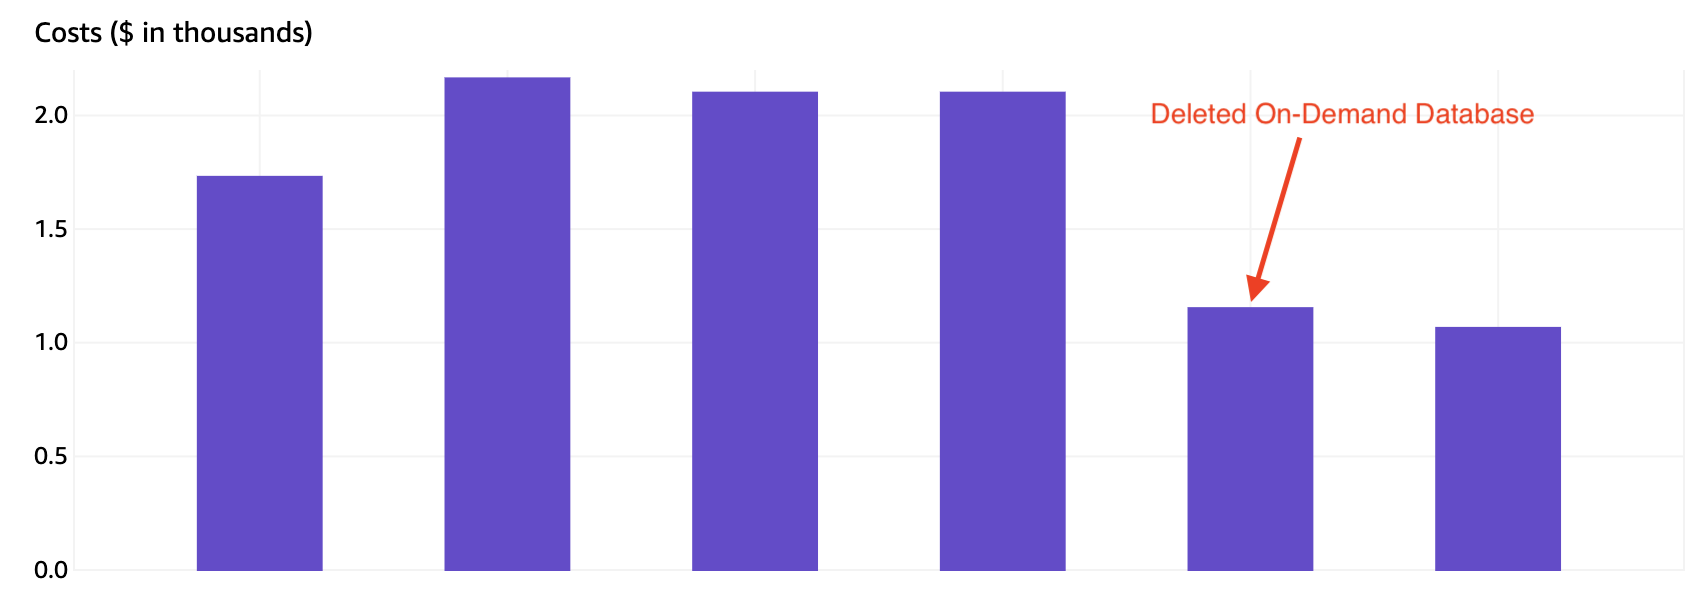
Relational Database Service - $56,799.12 (-4%)
RDS had a few significant changes in the past few months. In June, we dropped a 3TB table, which freed up storage and decreased cost. In August, we deleted our On-Demand replica, which also significantly impacted our overall AWS bill.
Service breakdown
- USE2-HeavyUsage:db.r5.12xl - $14,148.28 (-2.63%)
- This instance is reserved.
- This is our master MySQL database.
- We purchased another reservation and will continue paying this amount until Q3 2021.
- RDS:ChargedBackupUsage - $9,333.55 (-0.41%)
- These are our disaster recovery backups.
- We take additional backups and send them to a different region in case of emergencies.
- This cost is steadily increasing due to storage growth, but we’ve seen some optimizations here because we’ve reduced our overall MySQL workload.
- USE2-RDS:Multi-AZ-GP2-Storage - $8,893.26 (+5.63%)
- These are daily charges.
- We added storage to our database to accommodate our growth in Q2 but then dropped a 3TB table in Q3 so we won’t have to increase storage, and this cost should stagnate for a while.
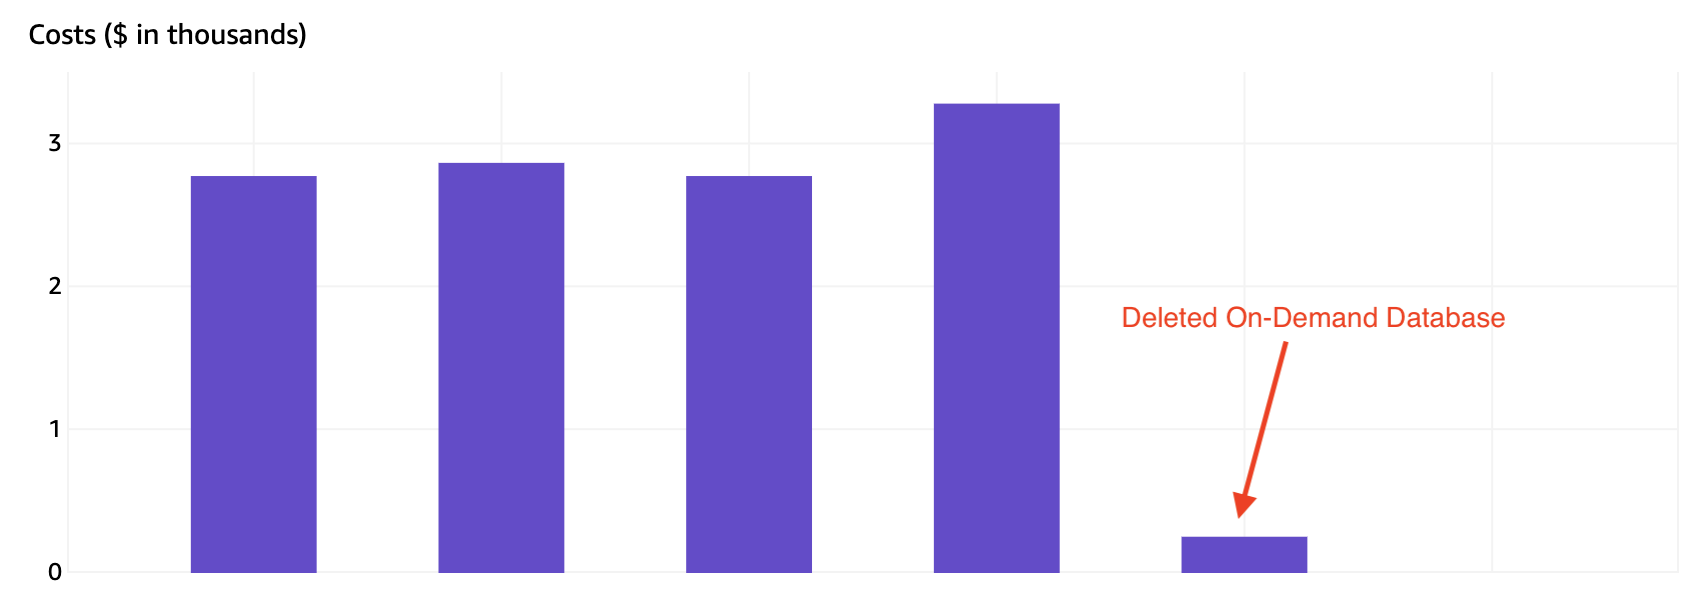
- USE2-InstanceUsage:db.r4.8xlarge - $3,511.59 (-58.13%)
- This is an on-demand instance.
- We dropped this instance because we no longer needed it, saving us a lot of money.
- USE2-RDS:GP2-Storage - $4,317.65 (-27.96%)
- This is the cost of our storage.
- The decrease in cost comes from dropping the extra 8TB database that we no longer needed.
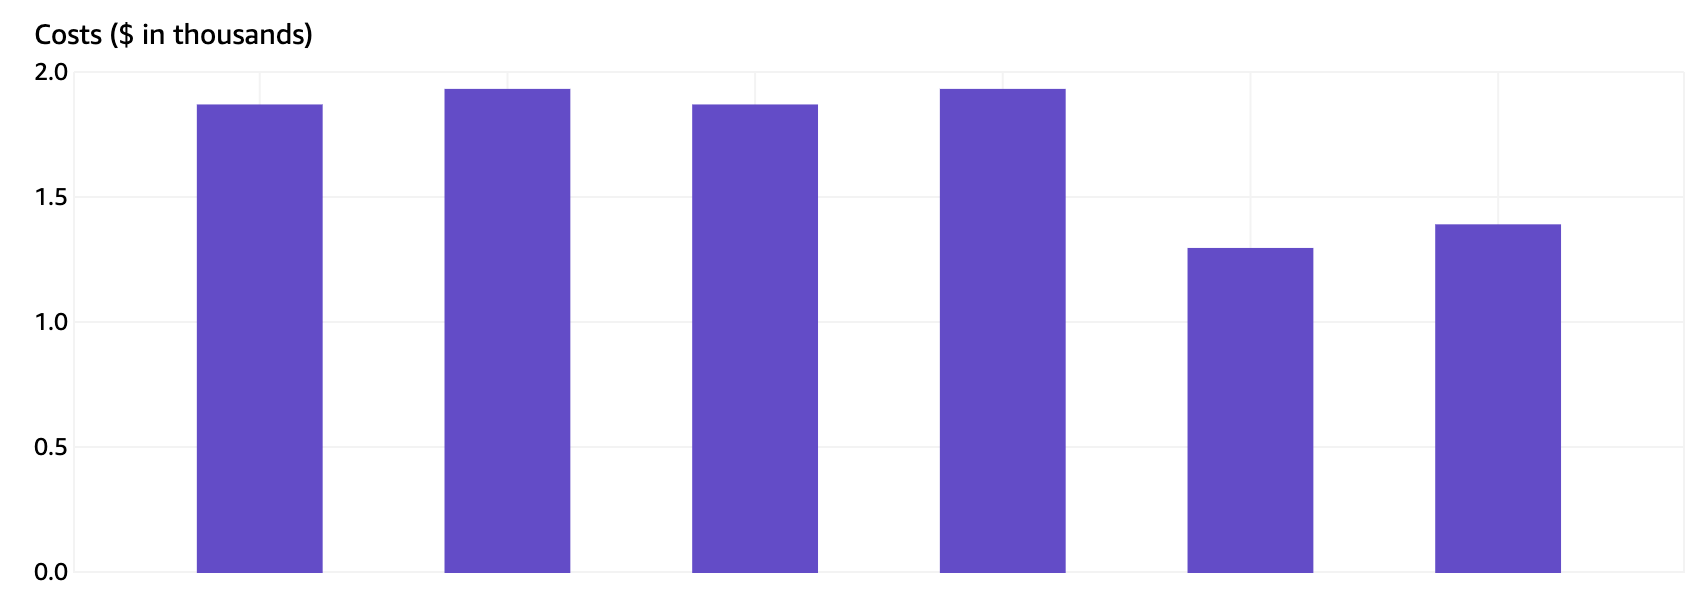
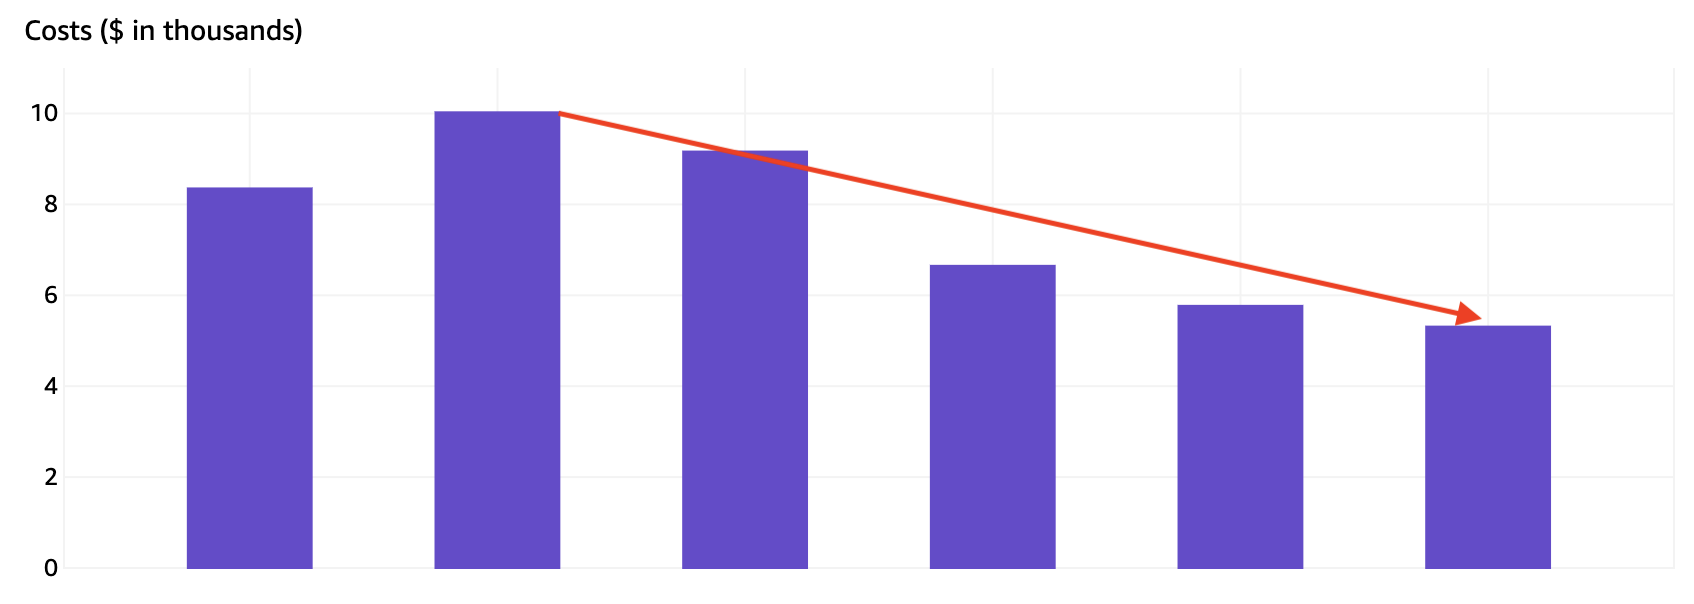
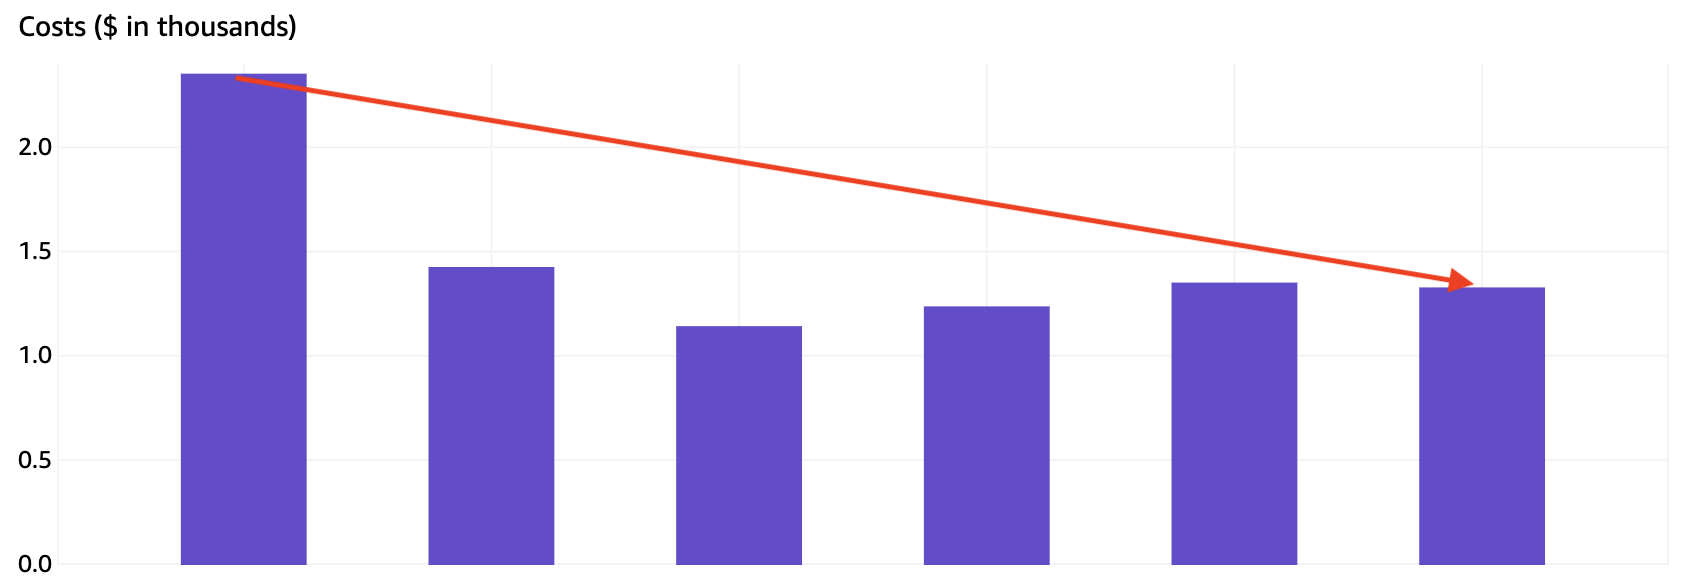
EC2-Other - $29,297.85 (-27.73%)
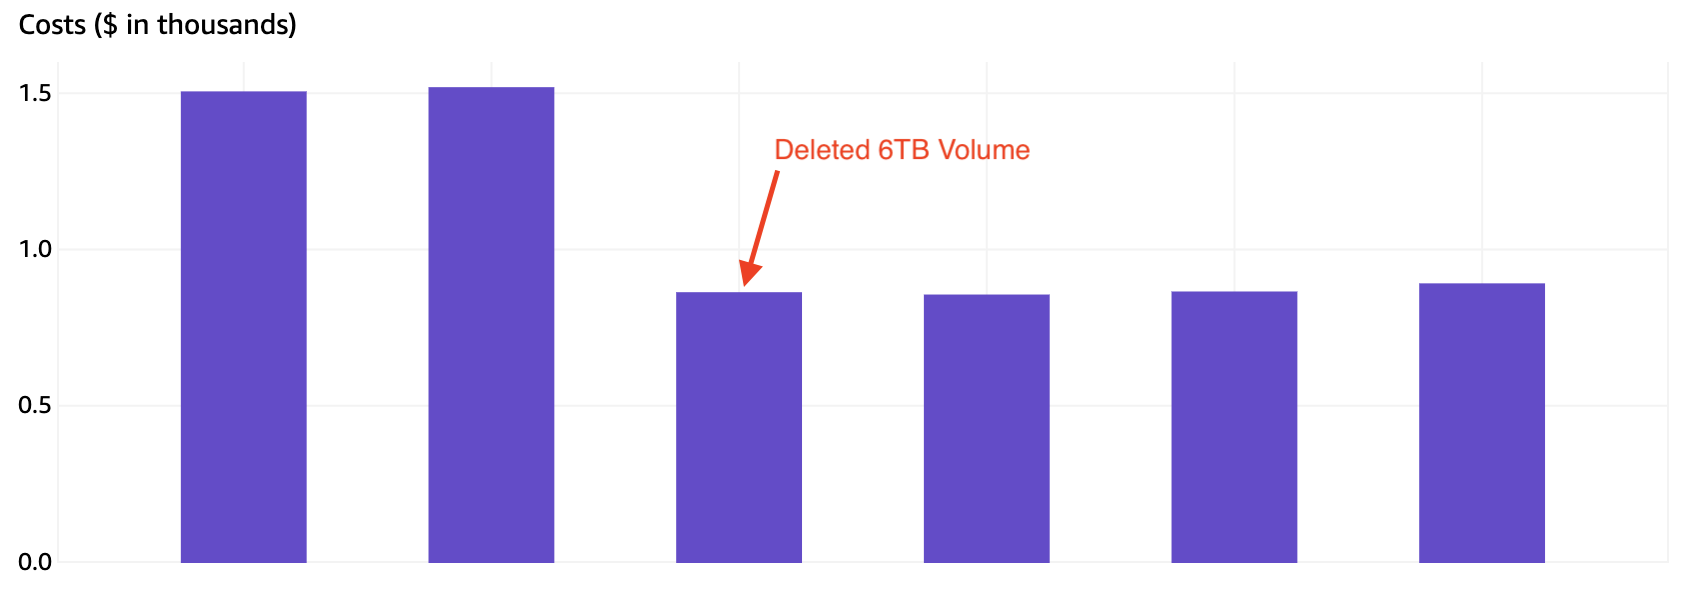
We started sampling our APM data in June, which decreased the data we had moving around our VPC. Once we reduced the amount of data moving through our VPC, our data transfer costs dropped by about 33%. Additionally, we found a two-year-old 6TB volume that wasn’t doing anything. Once we found and deleted that, our gp2 costs also decreased by about 33%.
Service breakdown
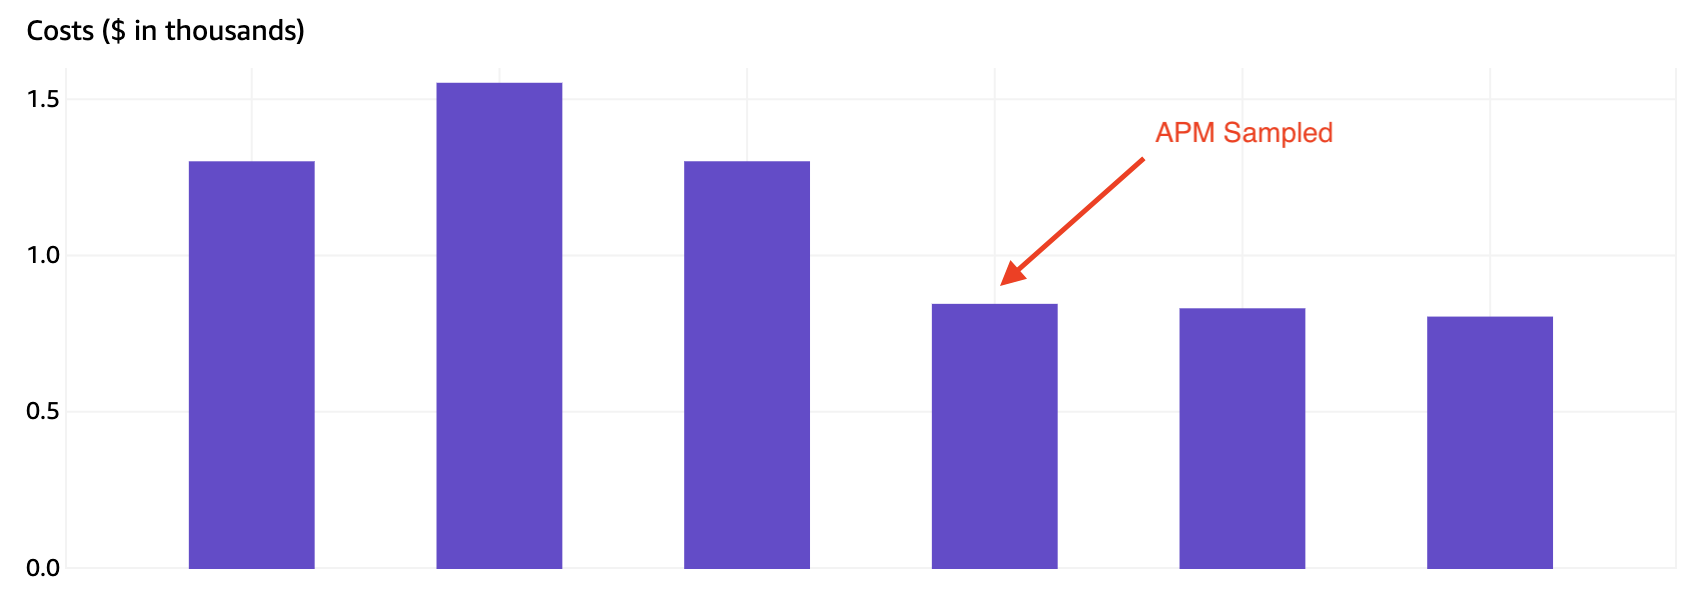
- USE2-DataTransfer-Regional-Bytes - $17,724.70 (-35.63%)
- This is the cost of data moving across AWS availability zones.
- The decrease in cost comes from sampling APM metrics we send to our servers.
- USE2-NatGateway-Bytes - $5,648.67 (+10.63%)
- We use a NAT gateway for our services to communicate with the internet.
- The increase in cost comes from our natural growth.
- The more our service gets used, the more this cost will increase.
- USE2-EBS:VolumeUsage.gp2 - $2,603.65 (-32.88%)
- This is the cost of having gp2 disks connected to our instances.
- We found a two year old 6TB volume in June that we deleted. Once it was deleted we saved about $600/month.
Savings Plan For Compute Usage - $31,574.40 (+23.9%)
We saved $11,982.31 in Q3 from purchasing our savings plans. 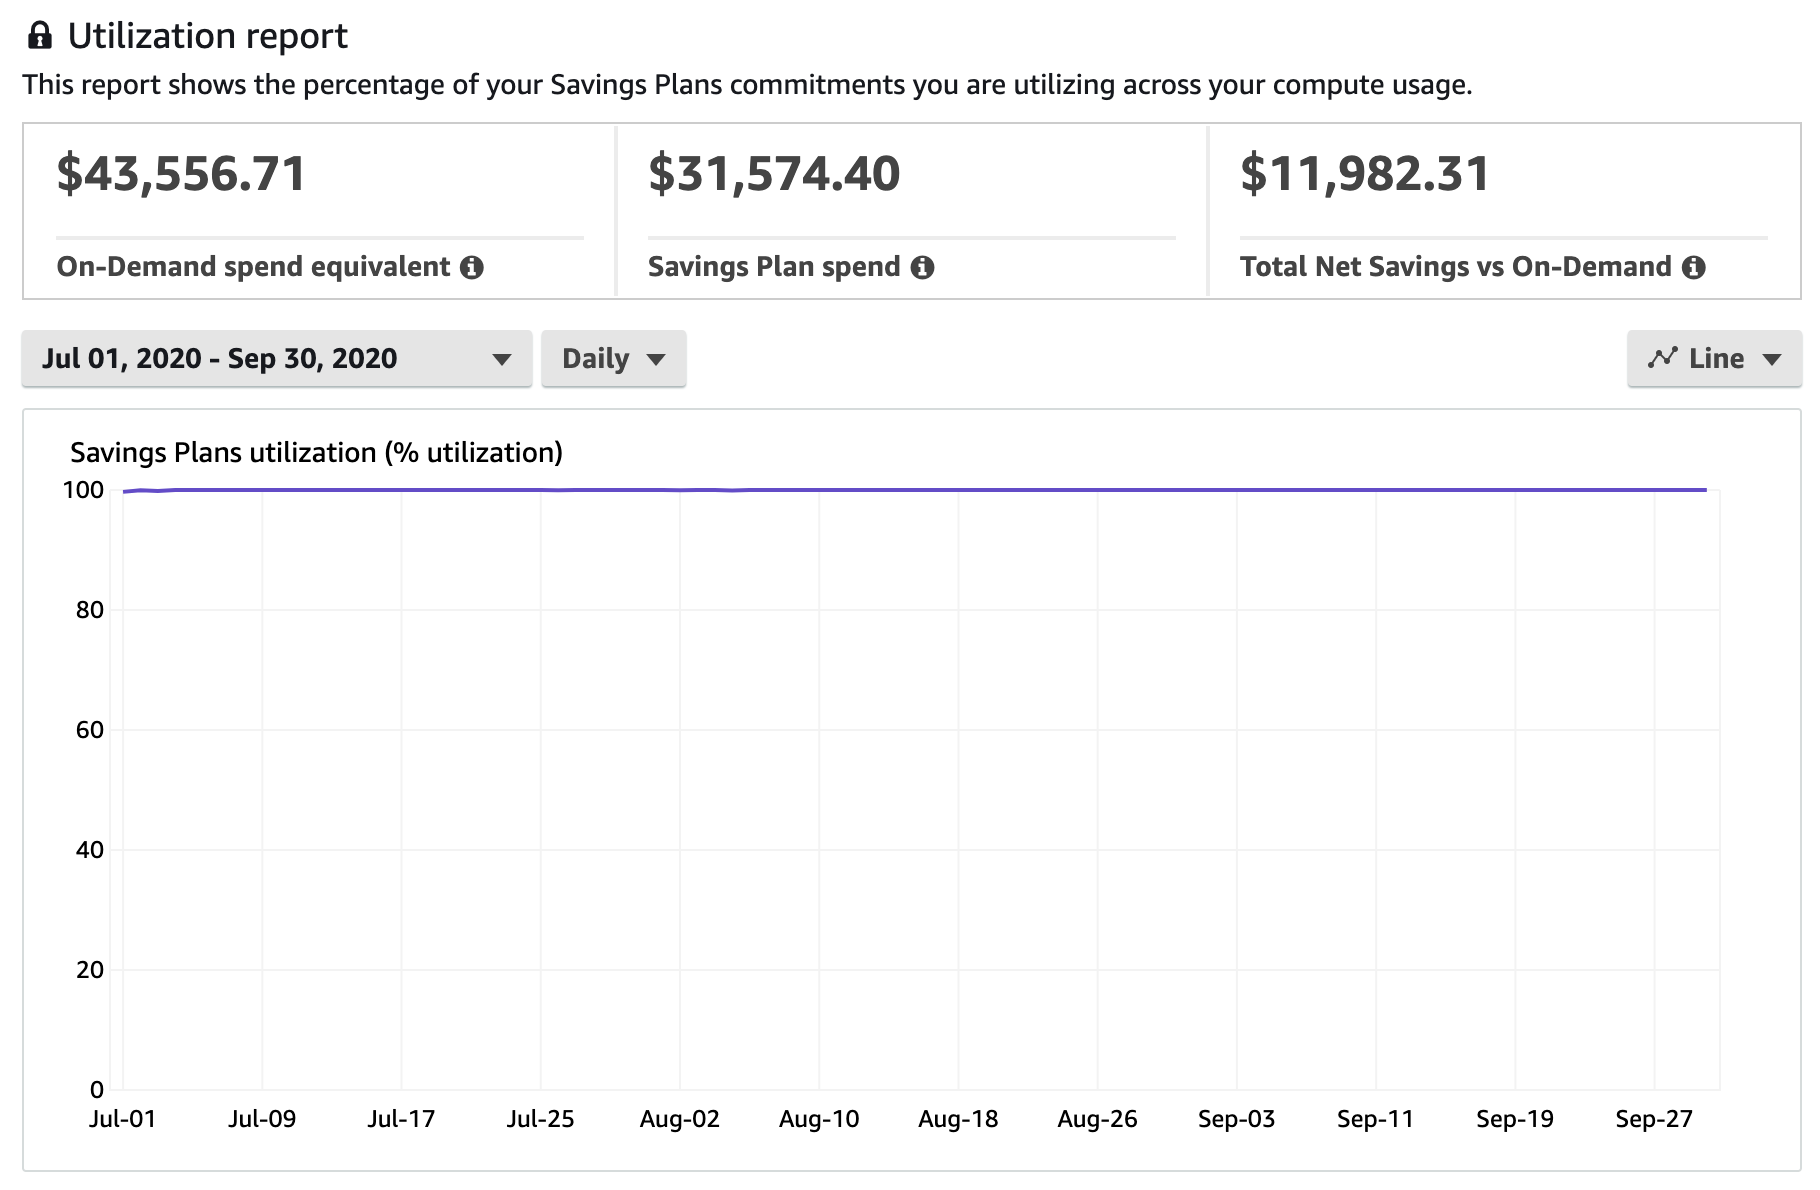
S3 - $17,923.08 (-22.23%)
We have continually focused on optimizing our S3 costs. S3 is a fantastic tool but understanding how it’s billed is key to using it as efficiently as possible. Introducing a CDN last year instead of sending raw S3 URLs has been an investment that continues to pay dividends as our data transfer out from S3 continues to decrease while our overall application usage increases.
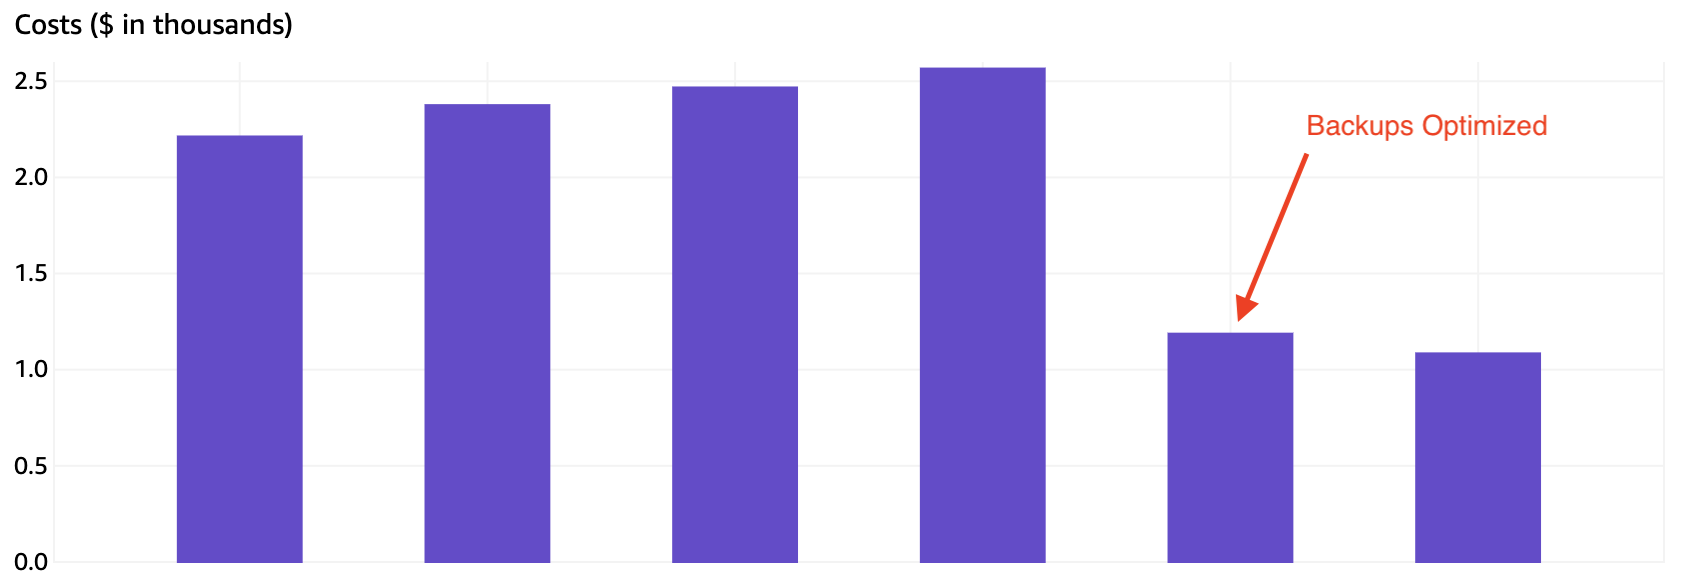
The most significant change in Q3 we made to S3 was optimizing our Cassandra backups. Instead of taking full backups every day, we use a new tool called medusa, which will diff what we already have backed up and what needs to be backed up. Medusa reduces the number of redundant objects stored in S3, which minimizes our total storage size. We made the change in August, and it has already had an incredible impact on how much we spend on S3.
Service breakdown
- USE2-TimedStorage-ByteHrs - $4,838.04 (-31.43%)
- A majority of this cost is our backups for Cassandra and Elasticsearch.
- We optimized our backups by reducing replicated data, which saved us a significant amount of money.
- We can find additional wins here by changing our storage class to infrequent access.
- USE2-DataTransfer-Out-Bytes - $3,900.54 (-20.51%)
- These are our new buckets that we’ve migrated all new storage to.
- As more people use our service this cost will increase because we’ll be serving more files from our buckets.
- DataTransfer-Out-Bytes - $3,461.23 (-21.78%)
- We continue to see billing wins here as the number of objects served straight from S3 decreases in favor of our Cloudflare CDN.
- These are our old buckets, so the number of objects uploaded here is decreasing, which subsequently means the number of downloads from here is falling.
- We continue to see a steady decline of data transfer from these buckets.
- TimedStorage-ByteHrs - $2,971.05 (-12.30%)
- These are our backups that we keep in a separate region.
- Because we optimized our backup process, we’re reducing duplicated data which is reducing our S3 bill.
Support - $15,779.26 (-4.24%)
The cost of support changes with usage. Because our AWS cost has decreased quarter-over-quarter, we spent less in Q3 than we did in Q2.
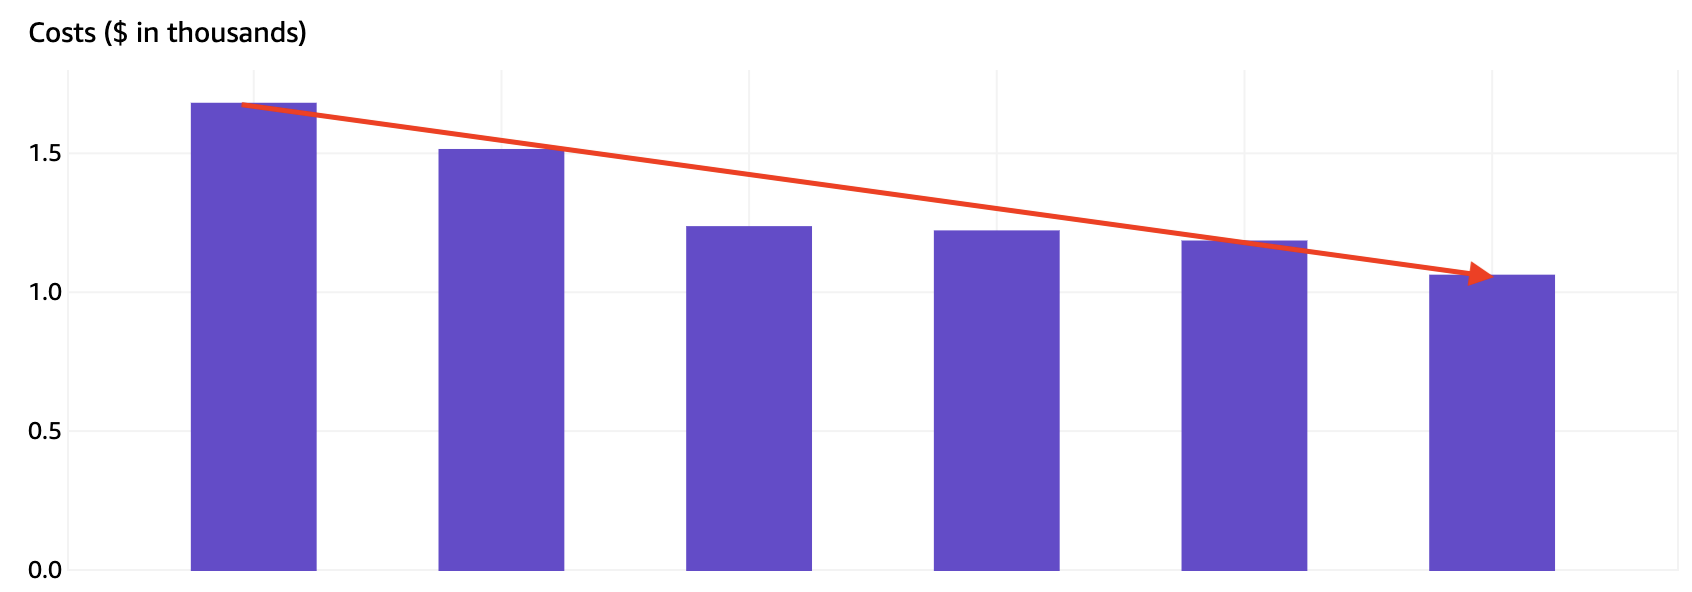
EC2-ELB - $8,019.36 (-15.98%)
ELB was another place we saw billing wins from sampling APM data. By reducing the amount of data flowing into our servers, we reduced the amount of data our load balancers needed to process, which has helped decrease our overall spend.
Service breakdown
- USE2-LCUUsage - $2,471.31 (-40.40%)
- This cost comes from the number of connections to our load balancers and their overall usage.
- The decrease in cost comes from sampling our APM data.
- USE2-DataTransfer-Out-Bytes - $3,009.22 (8.64%)
- This is the cost of data going out to the internet from behind our load balancers.
- The increase in cost comes from increased usage of our service.
- We can expect this cost to increase as more people use our service.
- USE2-LoadBalancerUsage - $2,314.80 (-3.34%)
- Load balancers are an integral part of our service. As more people use our service, this cost will continue to increase.
Conclusion
It is a continual effort to ensure our AWS bill is in a good place, but the effort is worth it. As ConvertKit continues to grow, our AWS bill stays predictable.